Projects
Here is a selection of some of my projects. Feel free to explore the URLs, view the demo videos, or the source code on GitHub
Business Intelligence & E-commerce

Airline Passenger Demand Analysis & Forecast — Power BI & Excel
This project analyzes airline passenger traffic data from San Francisco International Airport (SFO) to identify demand patterns, seasonal trends, and key factors influencing passenger volume over time. The dataset spans 24 years of monthly records, providing a comprehensive view of long-term travel behavior.
Real-World Use:
This dashboard demonstrates how data analysis can be used to monitor passenger demand, anticipate peak travel periods, and support better operational planning. The insights can help airports and airlines improve staffing, scheduling, and resource allocation to enhance efficiency and passenger experience.
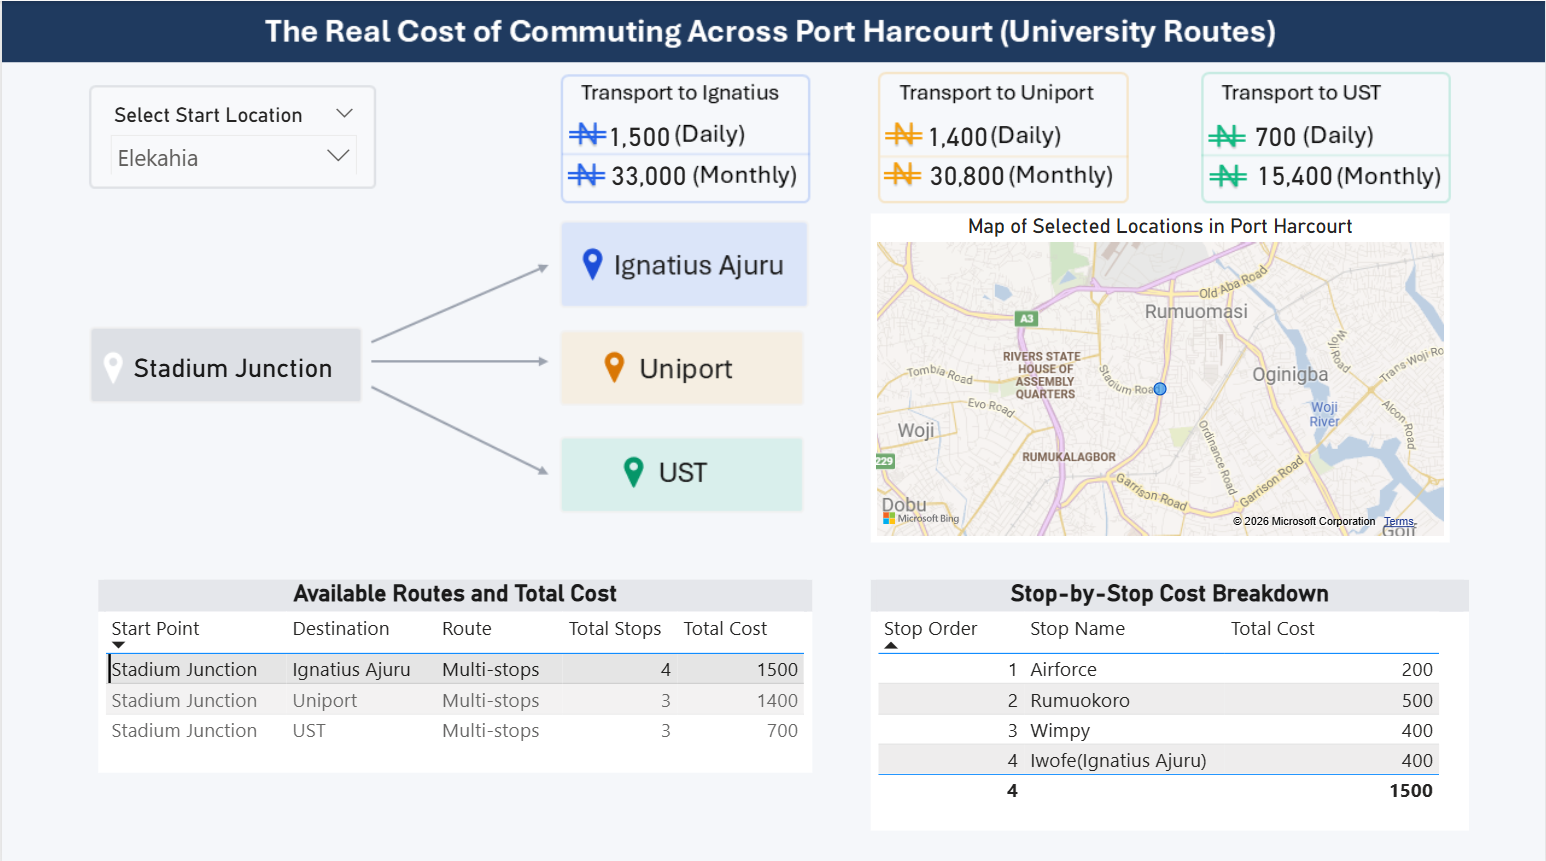
Transportation Cost Analysis – Power BI & Excel
This project analyzes transportation costs across different routes and locations to identify pricing patterns, cost differences, and key factors affecting transportation expenses. The dataset was manually collected to address the challenge of limited publicly available transportation data, making the project more reflective of real-world conditions.
Real-World Use:
This dashboard demonstrates how data analysis can be used to monitor transportation expenses, compare route costs, and support better decision-making for individuals, businesses, and organizations that rely on regular transportation planning and budgeting.
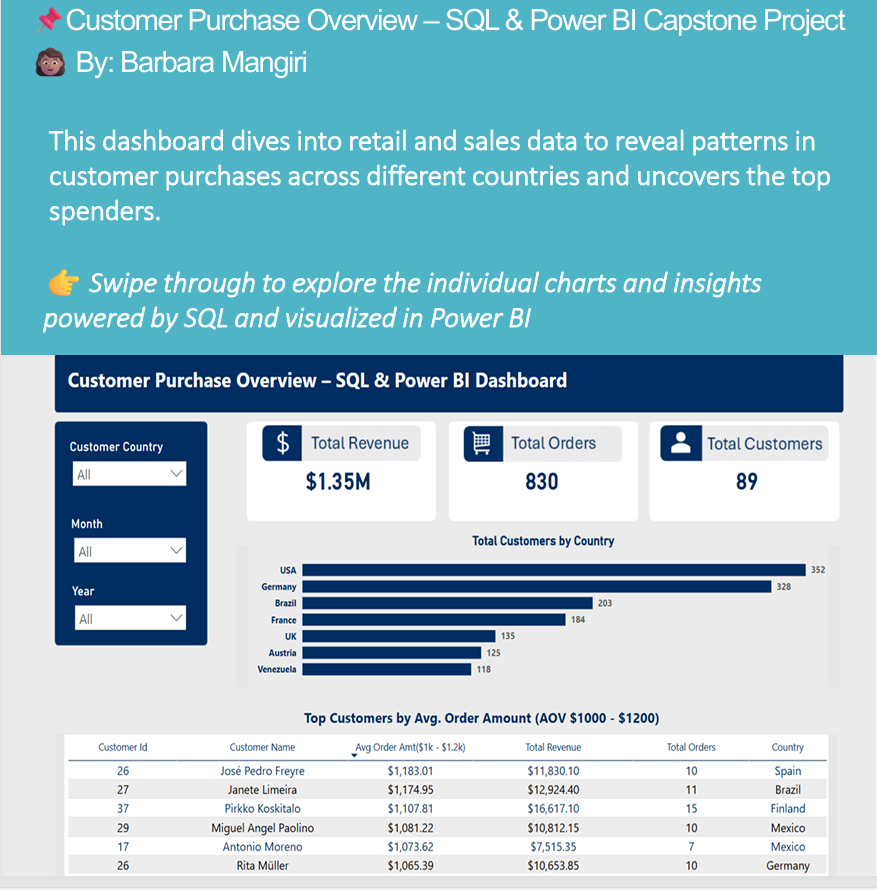
Customer Purchase Overview - SQL & Power BI
This e-commerce dashboard transforms raw sales data into actionable growth metrics. It tracks high-value customer segments, regional revenue distribution, and purchasing lifecycle trends, providing a clear window into business health and customer retention.
My Role:
I used SQL Server to extract and transform the data, writing queries to answer over 20 business questions. After creating SQL views, I connected the data to Power BI and built interactive visuals — including KPI cards, customer distribution charts, and a sortable table of top customers. I also troubleshot challenges around slicer functionality by consolidating multiple SQL outputs into a single view.
Real-World Use:
This tool helps marketing teams identify their most loyal customers, track revenue trends across different countries, and make quick decisions using dynamic filters for dates and locations.
Web Analytics & Intent
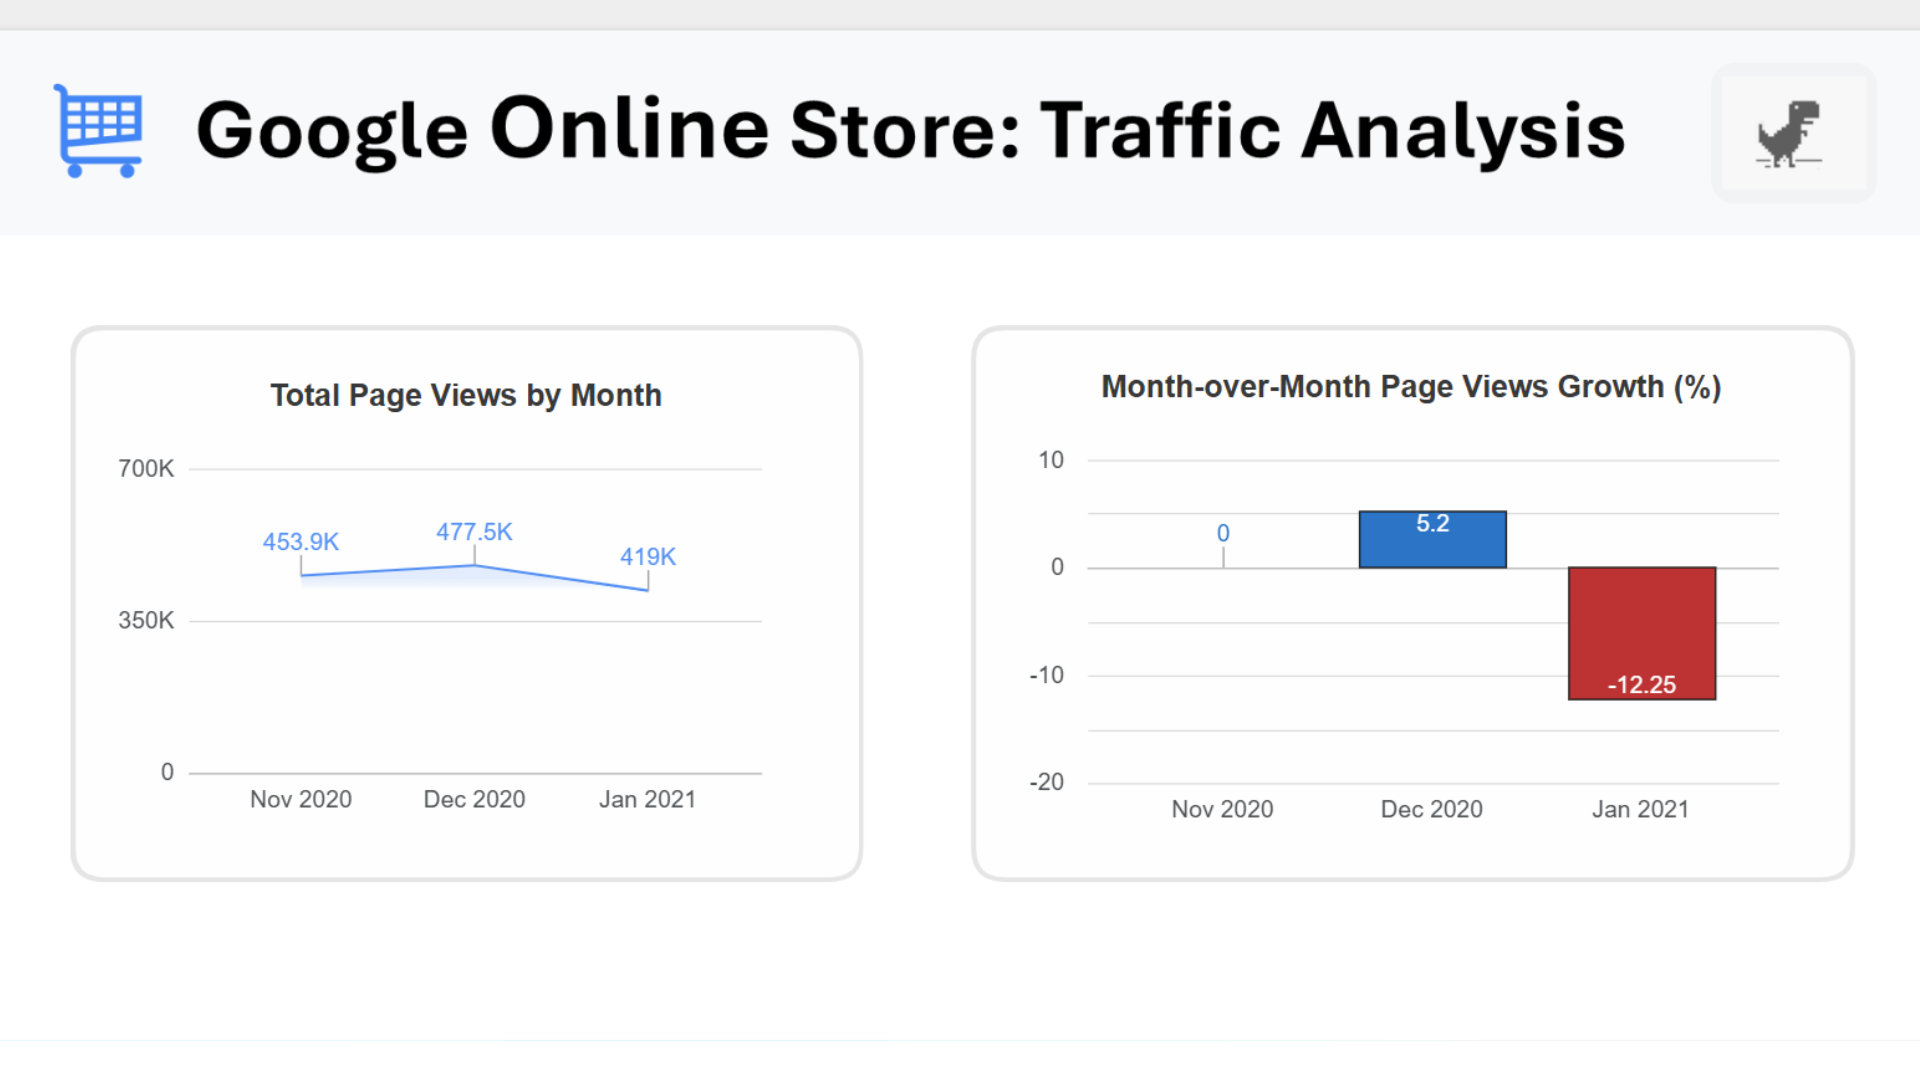
User Engagement & Growth Analysis – Looker Studio & BigQuery
This dashboard analyzes user engagement and growth patterns using the Google Online Merchandise Store dataset. The data was queried from Google BigQuery and connected directly to Looker Studio to explore traffic trends and month-over-month (MoM) growth in user activity.
Real-World Use:
This dashboard demonstrates how cloud-based analytics tools can be used to monitor website engagement, identify growth patterns, and support data-driven decisions around content performance and user behavior.
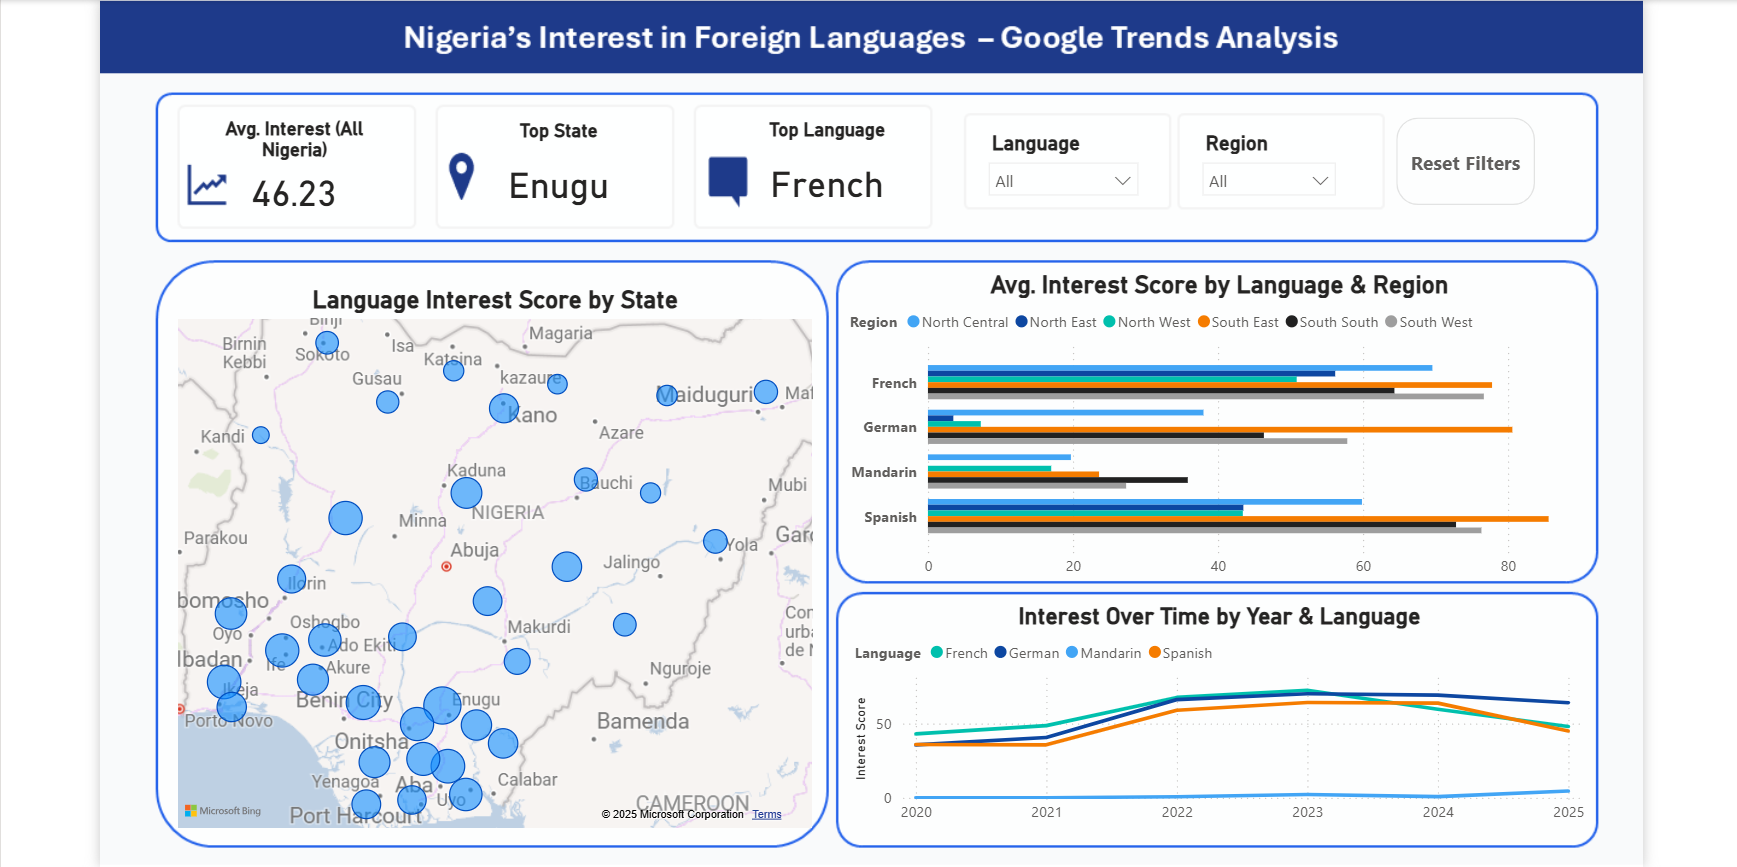
Nigeria’s Interest in Foreign Languages – Google Trends & Power BI
This interactive dashboard analyzes Google Trends data to reveal how interest in French, Spanish, German, and Mandarin varies across Nigeria’s 36 states. It highlights overall curiosity, regional differences, and top-performing languages by state.
Real-World Use:
This project showcases how search analytics can guide language-learning initiatives, highlight regional trends, and inform educators or cultural organizations about areas with high interest in foreign languages.
Data Automation
Automated Data Cleaner - n8n, Google Sheets, & Python
This project eliminates the manual work involved in cleaning raw Google Trends data.
My Role: I built an "event-driven" system that watches a Google Sheet for any new data. Once I paste raw data in, n8n automatically picks it up and sends it to a Python script I have running in the cloud (Render).
The API performs data cleaning and standardization using Pandas, ensuring consistent formatting and analysis-ready fields.
Once processed, the cleaned data is automatically written back to a separate Google Sheet via the Google Sheets API, creating a structured dataset ready for dashboards and reporting.
Real-World Use:
This project shows how automation can reduce manual errors and also get data ready for analysis faster.